CYTK CYTX BLDP IGC BUSE
Update chart this weekend!
By the way I am now officially part of the PPT community. You guys are going to see me alot on PPT with Ragin Cagun from iBankCoin.

Friday, September 25, 2009


Thursday, September 24, 2009
Overnight positions!
Thought my chart froze, reboot comp 2x then realize market closed! SO STUPID!!
Anyways.. sorry for the delay update!
I kept $QTWW and $MPG overnight!
Anyways.. sorry for the delay update!
I kept $QTWW and $MPG overnight!


WEAR YOUR SHORTS AND RUN~~!!
Been shorting solars all morning! IF you have follow my twits..
STP LDK FSLR JASO SOLAR TAN
YOUR CHOICE!!
AIG might be a good SHORT entry here(Cover stop above 46.50)!
STP LDK FSLR JASO SOLAR TAN
YOUR CHOICE!!
AIG might be a good SHORT entry here(Cover stop above 46.50)!
Wednesday, September 23, 2009


CASH IS KING!!
SERIOUS VICTORY today!! Will be sitting in cash! GOOD LUCK ALL!
Update: 4.05pm ET =====
Itchy fingers: Shorted $AIG from $47 overnight!
Update: 4.05pm ET =====
Itchy fingers: Shorted $AIG from $47 overnight!


Tuesday, September 22, 2009
Made it back for closing update!
Here are some overnight name you guys should consider!
abr afn amfi cbb cim ct flws gbe ico kfn srz yrcw
abr afn amfi cbb cim ct flws gbe ico kfn srz yrcw
Bank it for me!
I'm going to be out for the rest of the day. No overnight positions updates!
Watch these names for me!
$PIR (Like it with any spike with volume above $4.00)
$ABR (Like it above $3.10)
$BPOP (Like it above $2.75)
$PWAV (Like it above $1.75) Peaceout!
$YRCW (Like it above $4.28)
Watch these names for me!
$PIR (Like it with any spike with volume above $4.00)
$ABR (Like it above $3.10)
$BPOP (Like it above $2.75)
$PWAV (Like it above $1.75) Peaceout!
$YRCW (Like it above $4.28)


Monday, September 21, 2009


Overnight positions!
LONG: CVM AHR MPG
SHORT: STEC(covered today and reshorted- we might get a small bounce tomorrow) SVA (Still short)
SHORT: STEC(covered today and reshorted- we might get a small bounce tomorrow) SVA (Still short)


Sunday, September 20, 2009
Smart Scan with MarketClub - Review
I often get emails or twits like, "How are you doing this?", "Who taught you how to trade?", and "What filters do you use when scanning?" etc.... Let's just say that, on average, I have to go through 1,000 - 2,000 charts a day (depending on the price range and volume) to look for high probability setups. It usually takes me about 2 hours to go through all the charts, review my picks, and select the GOLDEN setups. Given my busy schedules, sometimes I just do not have the energy, mood, or time to go through 2,000 charts. I know money (or sometimes MEGA FAST money) come from hard work. However, when you are working nearly full-time and being a full-time Day/Swing trader at the same time, things could get a little crazy sometimes.
Anyway, let's cut the crap. I recently started using this service called the MarketClub and I was amazed by what they have to offer. There are two tools that I like the most and they are the "Smart Scan" and the "Chart Trading Triangles".
At first glance, the Smart Scan service seems a bit average with a "nothing special feeling" to it. However, the "wow factor" came in when I dug a little deeper. After I set up my filters and pressed the Scan button, the tool generated a list of charts that I would consider as the High probability trades. Now if you have been reading my blog, you know how accurate and how "I am on FIRE" with my trading. I take trading very seriously and I love what I do.
I was given permission to reveal MarketClub's service. The following would be a step by step manual on how to setup the filter for scanning. I would also show you what kind of filter I would use with Smart Scan.
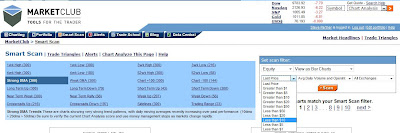
Step 1
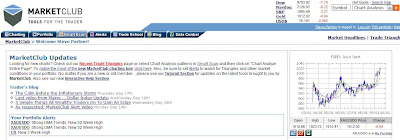
This would be the main page of Market Club once you have logged in.
Step 2
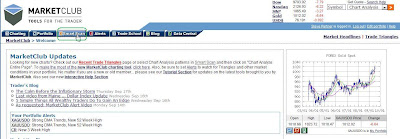
Click on the "Smart Scan" tab.
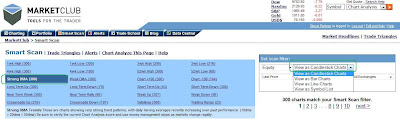
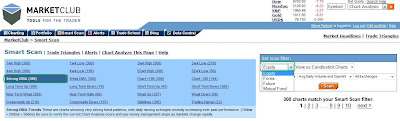
Step 3
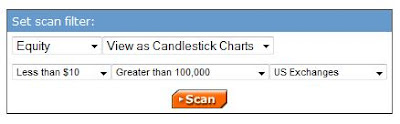
Under the Smart Scan tab, you should be able to see a selection of Technical Indicators on the left side of the page and the Set Scan Filters on the right side of the page. You can choose any filters under the Set Scan Filters, such as types of chart, volume range, stock price range, stock exchange, and market. (See screen shots below)
Types of chart
Market
Price range
Volume range
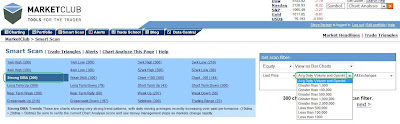
Stock Exchange
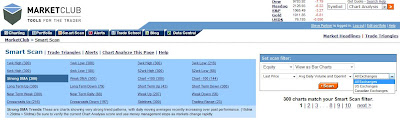
Here are my usual setups(filters)
Make sure you click on (Strong DMA) under the technical indicators on the left side of the page. Click "Scan" after you selected your filters, a list of high probability stock charts will then be generated. I was surprised to see my "Overnight Positions buy list" showed up on the scan.
Now if you need help with the charts, I would be more than happy to help you draw them to understand the setups better. You can send me your stock symbols through Twitter (@Tradermarket247) or Email: Tradermarket247@gmail.com.
The second tool that I like with MarketClub is the Trade Triangles.This video does a great job on explaining how the Trade Triangle works. It also tells you why "Buy and Hold" no longer works or how "Buy and Hold" no longer outperform Day/Swing traders. In my case, I'm up over 100%+ for the year and this is just the beginning.
There are other useful tools on MarketClub such Portfolio, Alerts, Trade School (for beginners), Blog ,and Data central. Once you sign up, you will get a 30 day risk-free trial (Money Back Guarantee!). Let's put it this way, if you can't make a 10% gain within a month using this service or at least make your subscription money back within two weeks of trading (I made my money back the next day), I would then suggest you to cancel the service (30 day risk-free trial) because you have some serious trading education to go through. I am not a snake oil salesman, I have tested and used the program to help my trading; and I know what works and what doesn't. Now try the service and let's get moving. Most importantly, "Thank me later!".
Anyway, let's cut the crap. I recently started using this service called the MarketClub and I was amazed by what they have to offer. There are two tools that I like the most and they are the "Smart Scan" and the "Chart Trading Triangles".
At first glance, the Smart Scan service seems a bit average with a "nothing special feeling" to it. However, the "wow factor" came in when I dug a little deeper. After I set up my filters and pressed the Scan button, the tool generated a list of charts that I would consider as the High probability trades. Now if you have been reading my blog, you know how accurate and how "I am on FIRE" with my trading. I take trading very seriously and I love what I do.
I was given permission to reveal MarketClub's service. The following would be a step by step manual on how to setup the filter for scanning. I would also show you what kind of filter I would use with Smart Scan.
Step 1

This would be the main page of Market Club once you have logged in.
Step 2

Click on the "Smart Scan" tab.
Step 3
Under the Smart Scan tab, you should be able to see a selection of Technical Indicators on the left side of the page and the Set Scan Filters on the right side of the page. You can choose any filters under the Set Scan Filters, such as types of chart, volume range, stock price range, stock exchange, and market. (See screen shots below)
Types of chart

Market

Price range

Volume range

Stock Exchange

Here are my usual setups(filters)

Make sure you click on (Strong DMA) under the technical indicators on the left side of the page. Click "Scan" after you selected your filters, a list of high probability stock charts will then be generated. I was surprised to see my "Overnight Positions buy list" showed up on the scan.
Now if you need help with the charts, I would be more than happy to help you draw them to understand the setups better. You can send me your stock symbols through Twitter (@Tradermarket247) or Email: Tradermarket247@gmail.com.
The second tool that I like with MarketClub is the Trade Triangles.This video does a great job on explaining how the Trade Triangle works. It also tells you why "Buy and Hold" no longer works or how "Buy and Hold" no longer outperform Day/Swing traders. In my case, I'm up over 100%+ for the year and this is just the beginning.
There are other useful tools on MarketClub such Portfolio, Alerts, Trade School (for beginners), Blog ,and Data central. Once you sign up, you will get a 30 day risk-free trial (Money Back Guarantee!). Let's put it this way, if you can't make a 10% gain within a month using this service or at least make your subscription money back within two weeks of trading (I made my money back the next day), I would then suggest you to cancel the service (30 day risk-free trial) because you have some serious trading education to go through. I am not a snake oil salesman, I have tested and used the program to help my trading; and I know what works and what doesn't. Now try the service and let's get moving. Most importantly, "Thank me later!".
Overnight positions Chart updates.
ANAD

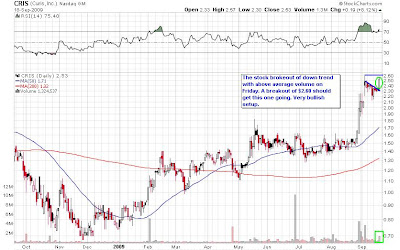
CRIS
CWSI

DSCM

DYAX

GBE

MVIS

NNBR

Stock Scan service review will be up in a few hours === Stay Tune.

CRIS

CWSI

DSCM

DYAX

GBE

MVIS

NNBR

Stock Scan service review will be up in a few hours === Stay Tune.
Subscribe to:
Posts (Atom)


